… helping a friend with a mathematical problem. More blogging soon.
-the Centaur
Words, Art & Science by Anthony Francis
… helping a friend with a mathematical problem. More blogging soon.
-the Centaur

One way to make yourself feel overwhelmed is to take on too many projects; the other is to take on too many responsibilities; the best way is to do the same thing at the same time. We missed our blogpost for yesterday; file it under (a) “you need to work a little bit harder than you want to” and (b) “best laid plans sometimes need to be set aside” again, as I ended up (a) trying to finish a bit of documentation, succeeding, but leaving work an hour late, and (b) having an hour and a half of conversations at the local coffeehouse, with only thirty minutes work time. Add to this a weekend mostly spent trying to solve my wife’s Audible problem and working on small press stuff, and I am so far behind on my writing.
The good news is, I got the first of my puzzles done for my proposed Cinnamon Frost puzzle book. The bad news is, that’s about eight projects deep on the stack of things I should be working on now. Hm, is that an accurate estimate? There’s the revised CLOCKWORK opener, the SPECTRAL IRON revision, the HEX CODE revision, the THIRTY DAYS LATER publishing tasks, edits for the 24HCD Survival Guide, first draft of PHANTOM SILVER, first draft of BOT NET first draft, and the rough draft of FAERY NUMBERS, plus the math groundwork for FAERY NUMBERS, not to mention a whole host of other small writing tasks we’ll lump into one, plus blogging - so I’m working on a pointer to something twelve items deep in my stack.
A proper computer scientist would be appalled, as might my editor for CLOCKWORK (it’s progressing, I promise! but it’s got to be awesome). But the good news is that I got a start on a wholly new project, seizing the inspiration before it evaporated.
And that’s how you catch lightning in a bottle. That and lots of caffeine.
-the Centaur
So I started off this year with all sorts of big plans - blogging every day, hitting the ground running at work - and it’s kind of funny to stumble so close to the starting gate. I missed blogging yesterday, and I missed today at work entirely due to bleah.
But things happen for a reason, I think; the world looks deterministic and impersonal down at the level of the laws of physics, but there’s a structure to it at a higher level which, if not real, is at least something we can take advantage of.
Case in point one: I’ve been pushing hard to finish a revision to the first chapters of my novel, THE CLOCKWORK TIME MACHINE, but it’s slow going as I’ve had to rethink my whole approach to the book. Digging through my other Jeremiah material for inspiration, I found an almost-finished novella, which my obssessive-compulsive tendencies sucked me into trying to finish. (Procrastinating on one project with another project is worth further discussion, I think, but that’s another blogpost for another time, if I haven’t already blogged on it, that is). But I made myself stop after I took a pass, and tried to tackle my daily blogpost.
At which point a friend dropped by to talk. I was at Coupa Cafe, a hot spot for great Venezuelan coffee and Silicon Valley’s startup culture, which isn’t just about startups, but is actually a hotbed for intellectual discussion. In thirty short minutes, my buddy and I dove far into the intricacies of deep learning, something which affects me a lot at work - and just as that was winding down, one of his other friends dropped in, and started quizzing me about the mathematics in my urban fantasy novels. Turns out he’s an expert in precisely the same areas of mathematics that my young protagonist Cinnamon Frost is - so I see more conversations in our future.
Definitively, that conversation was worth more than the schedule of my blogposts, so it was the right thing to do to fully engage with the human beings right in front of me rather than sticking mechanically to my plan. It’s really important to take advantage of these opportunities and to capitalize on them when they happen. That’s what this world is structured for.
Now, I’m not sure how I’m supposed to capitalize on catching my wife’s flu and waking up feeling like someone pummeled me with a half ton of bricks, but I’m sure there’s some lesson or opportunity in there. At least I … uh, dunno, got to drop off my dry cleaning on my way to the local restaurant for some hot chicken soup? Not sure what’s the lesson in there. (Though it’s probably a sign that I need to sit down with my laptop and catch up on writing documentation, which I can easily do from home).
-the Centaur

Hi, I’m Anthony! I love to write books and eat food, activities that I power by fiddling with computers. Welcome to 2016! It’s a year. I hope it’s a good one, but hope is not a strategy, so here’s what I’m going to do to make 2016 better for you.
First, I’m writing books. I’ve got a nearly-complete manuscript of a steampunk novel JEREMIAH WILLSTONE AND THE CLOCKWORK TIME MACHINE which I’m wrangling with the very excellent editor Debra Dixon at Bell Bridge Books. God willing, you’ll see this come out this year. Jeremiah appears in a lot of short stories in the anthologies UnCONventional, 12 HOURS LATER, and 30 DAYS LATER - more on that one in a bit.
I also have completed drafts of the urban fantasy novels SPECTRAL IRON and HEX CODE, starring Dakota Frost and her adopted daughter Cinnamon Frost, respectively. If you like magical tattoos, precocious weretigers, and the trouble they can get into, look for these books coming soon - or check out FROST MOON, BLOOD ROCK and LIQUID FIRE, the first three Dakota books. (They’re all still on sale, by the way).
Second, I’m publishing books. I and some author/artist friends in the Bay Area founded Thinking Ink Press, and we are publishing the steampunk anthology 30 DAYS LATER edited by Belinda Sikes, AJ Sikes and Dover Whitecliff. We’re hoping to also re-release their earlier anthology 12 HOURS LATER; both of these were done for the Clockwork Alchemy conference, and we’re proud to have them.
We’re also publishing a lot more - FlashCards and InstantBooks and SnapBooks and possibly even a reprint of a novel which recently went out of print. Go to Thinking Ink Press for more news; for things I’m an editor/author on I’ll also announce them here.
Third, I’m doing more computing. Cinnamon Frost is supposed to be a mathematical genius, so to simulate her thought process I write computer programs (no joke). I’ve written up some few articles on this for publication on this blog, and hope to do more over the year to come.
Fourth, I’m going to keep doing art. Most of my art is done in preparation for either book frontispieces or for 24-Hour Comics Day, but I’m going to step that up a bit this year - I have to, if I’m going to get (ulp) three frontispieces done over the next year. Must draw faster!
Finally, I’m going to blog more. I’m already doing it, right now, but one way I’m trying to get ahead is to write two blog posts at a time, publishing one and saving one in reserve. This way I can keep getting ahead, but if I fall behind I’ve got some backlog to fall back on. I feel hounded by all the ideas in my head, so I’m going to loose them on all of you.
As for New Year’s Resolutions? Fah. I could say “exercise more, blog every day, and clean up the piles of papers” but we all know New Year’s Resolution’s are a joke, unless your name is Jim Davies, in which case they’re performance art.
SO ANYWAY, 2016. It’s going to be a year. I hope we can make it a great one!
-the Centaur
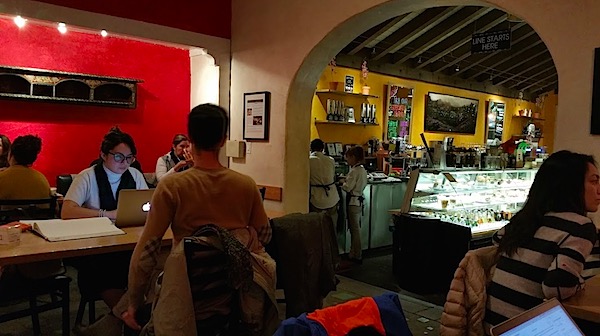
Pictured: The bookshelves of Cafe Intermezzo in the Atlanta airport, one place where I like to write books and eat food.
So another Nanowrimo draws to a close. The title says HEX CODE, but today’s writing was finishing out a few details in scenes in BOT NET (the second part of the Spellpunk trilogy manuscript I’m working on) and then a new beginning for ROOT USER (book 3). That new beginning, which played out a scene I’ve had in my head a long time, was very easy to write.
“That’s a damn shame,” says a distant voice, “so large an animal, in so small a cage.”
Muzzily, I grogs awake. What the fuck? Can’t they see I’m sleepin’? But then the words they’ve spoken starts to set in, balls in a Pachinko machine, rattlin’ in through the Pascal’s Triangle patterns in my brain to rack up a score of maximum annoyance.
The cage, you see, is large, for its type—a safety cage. Eight by thirty, made of elaborate wrought-iron vines, fashioned special from a welder we knows in Little Five Points, the safety cage is the largest and nicest I’ve ever been in—and the largest we could fit on our front porch.
The porch is big, and Southern, in front of a house big, and Southern, a third of the way down Fairview from Moreland, not three blocks from L5P. Pretty big even by Atlanta standards, but county code sez leave the front door unblocked, so thirty feet wide is was the cage limit.
Not that it feels limiting; there’s lamps and books and ferns and an ahw-SOOOME sectional sofa we found at an outdoor patio store, which stretches almost from the porch door on the left to the <regulation width with code #> stair down to my den.
It’s a full fourteen feet of sofa, fully twelve feet of it usable—which is a good thing, because stretched over it right now, covering just about its full length this very instant, is the enormous animal that the annoying interpopers have named.
Me.
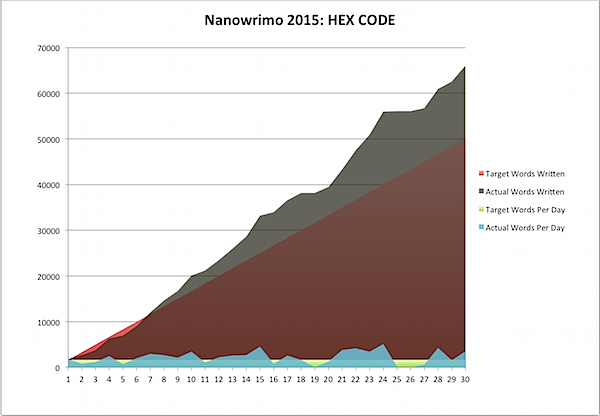
That’s why the last day of Nano has that spike: let your inspiration flow!
That brought me to over 65,000 words, the most I’ve done in Nano, as far as I know, ever:
SO I have a new record to beat. But I also cracked 700,000 words on my spreadsheet … which means, since I’ve done Nano at least three times before, my total Nano total is 850,000 words.
I feel pretty happy about that. Nano has brought so many creative ideas to the table, I can’t even begin to describe it. Easily a half dozen completely new ideas came to me this month - one even within the final writing session just before midnight tonight. I have to credit Nano for giving me this inspiration.
Now, onward to the next round of edits on THE CLOCKWORK TIME MACHINE … and the 50,000 other projects I’ve been putting off, like my library … though I *might* take out a little time to play a video game, or, perhaps, read a book … you never know ...
-the Centaur
So today I passed my all-time record (for as long as I’ve kept records) at Nano, completing 60,900 words at Nanowrimo. The key I think is not just taking this week off, not just keeping going, but daydreaming about my characters—then, whenever I get inspired, writing that scene. Almost all of the huge spurts you see below came out of that:
Today, it was pretty easy to write. I got about 500 words finishing up a few loose ends. Then I wrote a longer scene with Cinnamon and her fae mentor the Huntswoman, and almost a day’s worth of writing popped out of my keyboard. Then I decided to write another scene, one from ROOT USER (the third book in the trilogy, of the large manuscript I’m working on) and got 2000 words in about 30 minutes (!), all from choosing to write this:
But no matter how I tries to ignore it … I can’t ignore what they says next.
“And if they lose a hunt,” the jerkboy says, “guess what? They eat the loser—”
“You take that back!” I shouts, poppin’ to my feet. I hops over the nearest table and barrels down on the boy, who’s hoppin’ to his feet as well, his buddies standin’ to come to his aid, actin’ like I’m neither a girl he should play nice with nor a monster who could rip his throat out. “You take that back this instant!”
“What?” the boy says, eyes gleaming at me. “The part where they eat the loser—”
“We are not cannibals!” I screeches, snarlin,’ my whiskers comin’ in, my fur comin’ out.
“I bet she’s eaten her share,” one of the other boys says. “Like, weregazelles and shit—”
“The herbivores are our friends! We runs together! Nobody eats nobody on my hunt!”
“Your hunt,” he says. Everyone’s circled around us now, the boy standin’ out front. He’s big, so, I guesses, he guesses he can take me in a fight. Good fuckin’ luck. He grins with a nasty smile. “Like anyone would follow you—”
“I had twelve followin’ me on my last hunt,” I says. “Thirteen, actually—”
“I thought you could count,” he says. “What, you lose one? Eat one?”
I snarls and steps forward, and he leans back, fists up. I raises mine.
Then I turns away. “Not worth it,” I mutters, lookin’ at the huge crowd around us. He swings and clocks me behind the ear, and I kinda shrugs and shakes him off. “Not worth it at all,” I mutters, boltin’ through the crowd, walkin’ fast towards the exit. “At all—”
“Where are you going, Miss Frost,” says the proctor.
“The deans’s office,” I says. “I just picked a fight.”
“Wait just a minute,” he says, hand reachin’ for me, but I shrugs him off.
“Get off me, or I go to the safety cage,” I says, snarlin. “And call for my Mom.”
“Yeah, call your mother,” says the jerkboy, who followed me.
“Christopher, I see your mouth is open,” the proctor says coolly. “Close it.”
And the scene which follows, in which Cinnamon goes to see the Dean of the Claremont Academy, who’s more cool than even I anticipated — I mean, drill sergeant in a former life? Really? Makes sense. And helped me crack 60,000 words:

But the point is, never give up on Nano. It will continue to reward you, all the way to the end.
-the Centaur
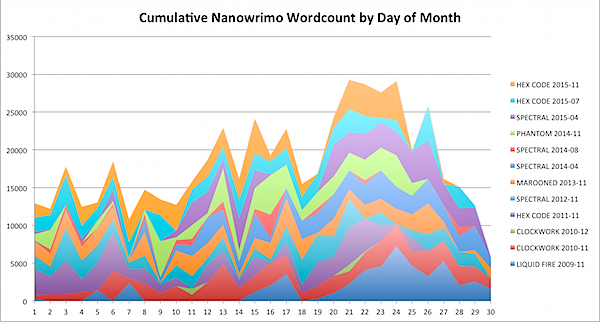
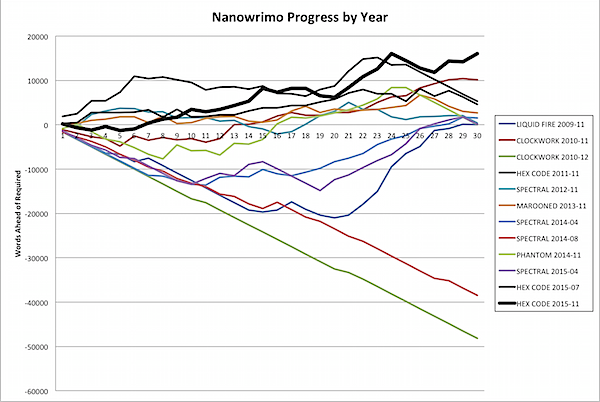
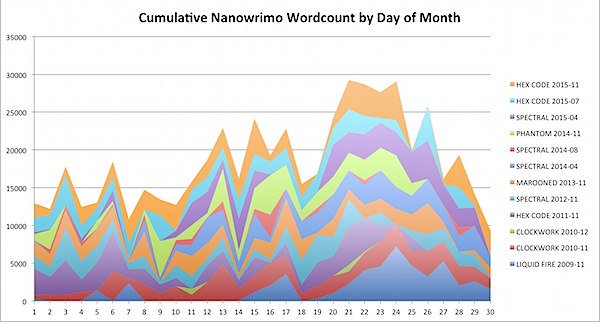
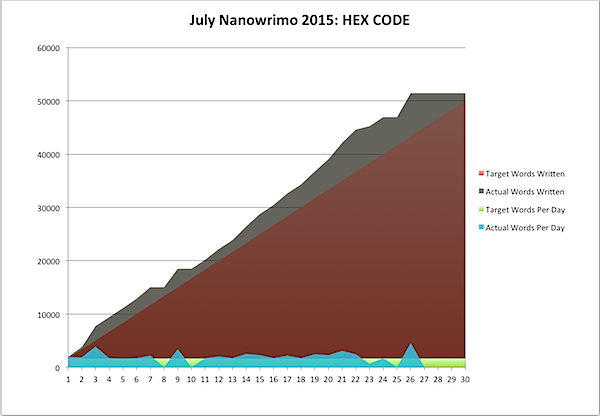
I normally take off the week of Thanksgiving to finish Nanowrimo, and if you look at the stack of seven hundred thousand words that I’ve written in Nanowrimos, you can see the surge there clearly. (I bet it would be even more clear if I only counted the November Nanos, but I’m doing this graph in Excel, not Mathematica or Processing or R, so sue me for laziness).

But even so, it’s easy to see (if you are me) that I’m perilously close to beating my all time record for November, set in 2010 with THE CLOCKWORK TIME MACHINE with 60,164 words. And there ARE four days of Nano left, so I just may keep pushing on. My record per day that I’ve kept records is over 7000 words (almost certainly the mad scramble to finish LIQUID FIRE in 2009 after getting edits on BLOOD ROCK early in the month), so that’s easily doable. And my average for these four days is close to 4000 words. One year I even made 5300 words today, on the 27th, so keep your fingers crossed.
But as much as I like to take this week off - as much as antisocial me doesn’t want to accumulate obligations on my time, which I freely admit made the first half of this week miserable from the temporal anticipation - I really do enjoy hanging out with my friends and family, and even though I don’t get the chance to fly home to see my blood family over this holiday, I loved having the chance to get together at the house of my “brother from another mother” and his wife and to join them on their Thanksgiving.
Family, friends, and good times aren’t the only important things in life. But they sure do make life a lot better.
-the Centaur
At last, I’ve completed my 15th National Novel Writing Month challenge successfully! Victory, for the thirteenth time!
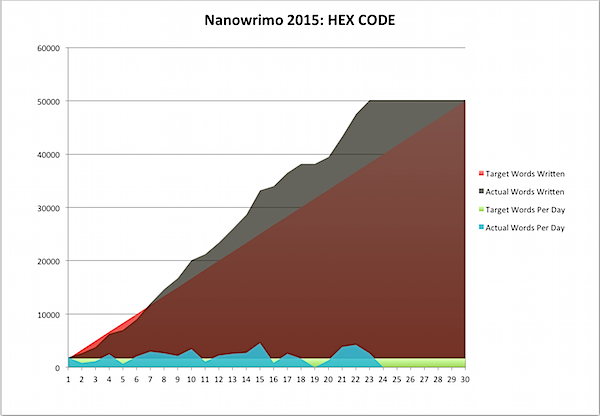
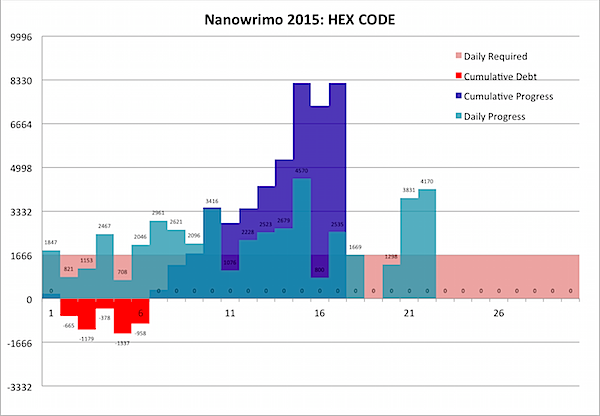
The graph says “HEX CODE”, but as I’ve said before, I discovered in July’s Nano that the manuscript I was working on was actually a trilogy - I already knew that Cinnamon appeared in a trilogy of books called HEX CODE, BOT NET and ROOT USER, but I was puzzled as to why the HEX CODE manuscript seemed both so cramped and so overstuffed. The reason? I was already writing the trilogy, with a discernible “hex code” appearing first, followed by a “bot net” then a “root user”. So I split the manuscript up … and just kept writing, until, earlier this month, I rolled over the end of HEX CODE.
Perhaps that’s why I was doing so well this year, or perhaps it’s because I’ve written almost seven hundred thousand words in National Novel Writing months at this point. But regardless, I had some real bursts of creativity in there. But even then, I have to tell you: it was always hard. The hardest words on this one were the last 8 … when I thought I was done. But you have to keep going! And the scene that popped out after that is beautiful.
Regardless, National Novel Writing Month is a joy to participate in, and I’m glad to have done it. The people and the connections I’ve made, the friendships I’ve built, the fantastic events like the Night of Writing Dangerously, the great writing programs that Nano supports, and the worldwide outbursts of creativity have made it all so worthwhile I plan to do it again and again.
So, for now, I leave you with one last excerpt, from BOT NET … containing something I learned about my world of werekindred tonight, when I had to write … and let my creativity take over. As always, excerpts from Nano are first draft material, so, consider yourself advised … but I love what I discovered about Cinnamon’s warehouse tonight.
I looks down at them. All their eyes are glowin. The moon’s gotten into them. It will be up soon. I gots to go take them runnin’ now, or they’ll go crazy. I stands before them, rearin’ up a little, puffin’ my tiger cheeks, lookin’ down at them, and they gets the hint, and steps back from the wall, towards me, towards me, the tiger.
“Alrright,” I snarls. “None of ya get killed, or, as Mom would say, you’re grrrounded. ”
They all laughs, and I grins and stamps a paw.
“You feel the moon?” I says.
“We feel the moon!” they all shouts back. Whoa. Better response then I expected.
“I said, do you feel the moon!” I roars.
“We feel the moon!” the hunt screams.
“Then show me your beasts!” I snarls.
The lawyer strips off his jacket, his shirt, snarling, his head poppin’ out wolf so fast even Tully would have been proud of it. Hanser is a lynx before I’ve gotten a chance to look over at her, and the rest are poppin’ and changing. One buck is havin’ trouble, horns comin’ out of his head, fur crawlin’ over his body, but still no quad form, and I nods to Hanser, who pads over and licks at him playfully as he falls to the ground, crosseyed, eyes half pulled back like a buck’s.
But Willard, man, Willard’s havin’ real trouble. He’s bulked up, six and a half feet tall now, a black fur rug rippling out of his back, and oh-my-bod, what delicious muscles. But the shag carpet, it’s as far as he goes. He grunts, strains, then shakes his head.
He ain’t even taken his shorts off. He knows this is as far as he can go. Personally, I’m glad to have a half-human in the pack—easier to get feedback. He’s obviously got control, or they wouldn’t have given him to me, but is also obviously new to the Life. He needs help.
I prowls up to him.
“This your limit?” I asks, starin’ him in the eye. He nods, embarrassed, and looks away, but I raises a paw and catches him under the chin with the curved side of one of my claws, lookin’ at his head. “Listen to me: there’s no shame in our affliction. Repeat it.”
“Therrre’s no shame in ourrr aff—affl—affliction,” he says.
“Only prrride in our powerrr,” I says. “All of ya. Repeat it.”
“There’s no shame in our affliction,” the lawyer says, like, real articulate, even though he’s on all fours now, and his head’s all wolf. When’s this lack of concentration supposed to kick in? He shakes that wolf head back and forth, then howls, “Only prrride in our powerrrr!”
“Therrre’s no shame in ourrr affliction,” I roars, “only prrride in our powerrr!”
I prowls back and forth in front of them, listenin’ to them repeat it, those that can. The rest yip and yap and bark … except for the buck, who’s sittin’ there, dazed. His eyes are stuck halfway between human and stag, and he looks winded and dazed.
“But never rushin’ the hardest job any human ever has to do: controllin’ their own beast,” I says, steppin’ up to him. “You ain’t ready. There’s no shame; there’s always next moon. But this one, you ain’t ready. You relax, let the elders care for ya.”
The buck nods, still crosseyed, lickin’ his lips.
“Yyyouw waaant meeee,” Hanser yips, then goes quiet.
I looks back to see Fischer, standin’ there, under his broadbrimmed hat. He’s got the doc with him, black bag under his arm, I mean, seriously, cliché! But he nods to us, and they goes and sits with the buck as the rest of my hunt firms up before me.
“Four in front of you, Willard,” I snarls. “Or anyone else wanna sit this moon out?”
The pack howls and yips and brays, crowdin’ forward.
“Nnnever!” Willard says, beatin’ his chest.
“Yall wanna run?” I snarls.
The pack makes a yippin’. Weak.
“Eye said, y’all wanna run?” I roars.
And my whole hunt howls at the top of their lungs.
“Then let’s rrrun,” I roars, and Hanser at my side, bolts off into the forest.
Enjoy. And onward!
-the Centaur

Almost at the end of Nanowrimo. Closing in. About a day’s more work to go. Perhaps I’ll get to enjoy my vacation.
Oh, an excerpt:
FROM: “Cinnamon Frost” <frost.csf@dwa.gov>
TO: “Norcross Office” <everyone-norcross@dwa.gov>
CC: austin.wj@dwa.gov, cagayan.rg@dwa.gov, waldona.dg@dwa.gov
SUBJECT: Your security totally sucks
Okay. Hi! Straight to it: your security sucks.
Oh, wait, most of you don’t know me. Well, some of you may know me from “when the APD almost got its ass sued off” or “that time I saved the DWA's ass in the tunnels,” but for the rest, uh, Hi! I’m Cinnamon. I like to gnaw on things and do math.
SO ANYWAY, y’all have been botherin’ me a lot, so I hacked ya.
Hacking a government agency won’t have any negative repercussions, now will it? But very fun to write...
That’s why the last two days have been so productive! More tomorrow.
-the Centaur.
 Somewhat over 25,000 words. Closing in on the end of HEX CODE. That is all...
-the Centaur
Somewhat over 25,000 words. Closing in on the end of HEX CODE. That is all...
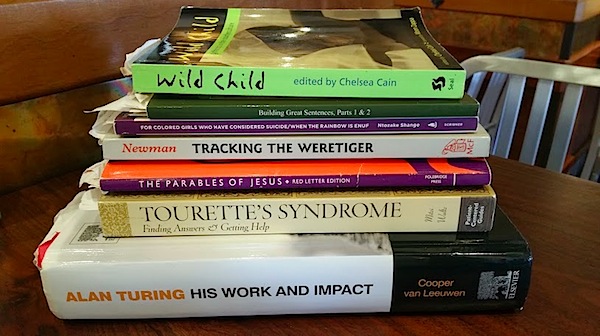
-the Centaur  What you see there is my "working stack" at home ... the piles of books for my most active projects. These include Dakota Frost (shelves to the left and right that you can't quite see), Cinnamon Frost (middle shelf on the right, middle center shelf and others below), robotics at work (top shelf on the right), Thinking Ink Press (bottom visible shelf on the right and middle center shelf), Lovecraft studies (middle center shelf and top shelf on the left you can't quite see), and general writing (above, below, all around).
 I accumulate lots and lots of books - too many, some people think - but there's a careful method to this madness, as most of these books are not recreational, but topical, filling out a library around things I'm trying to accomplish. This means that when I'm working on a problem on, say, a Cinnamon Frost novel, and get stumped, I can have the pleasant experience I had last night of glaring at a Wolfram MathWorld article, not finding all the info I needed, peering through the references ... and finding that the references pointed to a book I had on the topic, right in the Cinnamon shelf (pictured above).
 For a long time I was terrified of my own library. Well, not terrified, but I'd piled up and accumulated so much stuff that I couldn't effectively use it. This has been accumulating since the days of my condo in Atlanta, which was approaching near gravitational collapse, but I've made two major pushes to clean up the library since I moved to California, which organized it usefully, as I've reported on previously, and since then two major pushes to clean up the files. I've still got a lot go go - you can see more piles below - but now I've got a better system for organizing paper, I am starting to develop a system to get things out of the library and back to used bookstores (slowly, grudgingly, occasionally) and ... I actually find myself wanting to go in here again.
 The piles are still scary, but now I've got a nice reading area set up, which I can lean back and be cozy in...
 My current reading pile and art projects are intimidating, but now organized and useful and even attractive ...
 My cognitive science section has developed a cozy, hallowed feel, that makes me want to dig in more ...
 ... and at last I once again have a workspace which makes me want to sit down and work, or write:
 I can't tell you how healthy that feels. I need to stay on top of that. But for now ... time to get back to it.
 -the Centaur
P.S. Yes, I do actually use all those computers and monitors, though the one on the far right is slowly getting replaced by the floating hoverboard of an iMac that is now struggling to supplant my MacBook Air as my primary computer (good luck, you'll need it). For reference, there's my ancient MacBook Pro on the left, which formerly served as my home server; the iMac that's replacing it, hovering over the desk, a MacBook Air which is my primary computer, and the secondary keyboard and monitor for my old Linux workstation, which is about to be replaced because it's not beefy enough for my experiments with ROS.
... why do you ask?
Technically, a Cinnamon Frost novel is an urban fantasy novel with a young adult protagonist. I am doing some work to make it young adult friendly, up to a point, but at some point you have to acknowledge that as much as we all love her, we've got a formerly homeless and abused teenage weretiger with behavior problems as our protagonist, in a world which is a "real" world, not a young adult friendly world - and she's supposed to be a math genius, and if I'm going to have a story with a math genius, dang it, I want the math to be real math, even if takes me a while to figure out how to coherently explain what the heck a "loxodrome" is.
It's the spiral you get if you run stairs up the side of a dome, but your architect was lazy and made the stairs cut a fixed angle to the meridians in their drawing, rather than a fixed angle that's useful for constant climbing. Sigh. That's not clear either. Needs more work. Back to it ...
-the Centaur
P.S. And yes, I'm still on track for Nano.
-the Centaur
P.S. Yes, I do actually use all those computers and monitors, though the one on the far right is slowly getting replaced by the floating hoverboard of an iMac that is now struggling to supplant my MacBook Air as my primary computer (good luck, you'll need it). For reference, there's my ancient MacBook Pro on the left, which formerly served as my home server; the iMac that's replacing it, hovering over the desk, a MacBook Air which is my primary computer, and the secondary keyboard and monitor for my old Linux workstation, which is about to be replaced because it's not beefy enough for my experiments with ROS.
... why do you ask?
Technically, a Cinnamon Frost novel is an urban fantasy novel with a young adult protagonist. I am doing some work to make it young adult friendly, up to a point, but at some point you have to acknowledge that as much as we all love her, we've got a formerly homeless and abused teenage weretiger with behavior problems as our protagonist, in a world which is a "real" world, not a young adult friendly world - and she's supposed to be a math genius, and if I'm going to have a story with a math genius, dang it, I want the math to be real math, even if takes me a while to figure out how to coherently explain what the heck a "loxodrome" is.
It's the spiral you get if you run stairs up the side of a dome, but your architect was lazy and made the stairs cut a fixed angle to the meridians in their drawing, rather than a fixed angle that's useful for constant climbing. Sigh. That's not clear either. Needs more work. Back to it ...
-the Centaur
P.S. And yes, I'm still on track for Nano. 
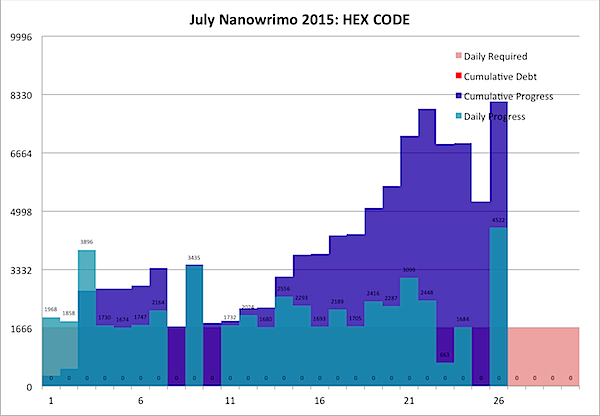
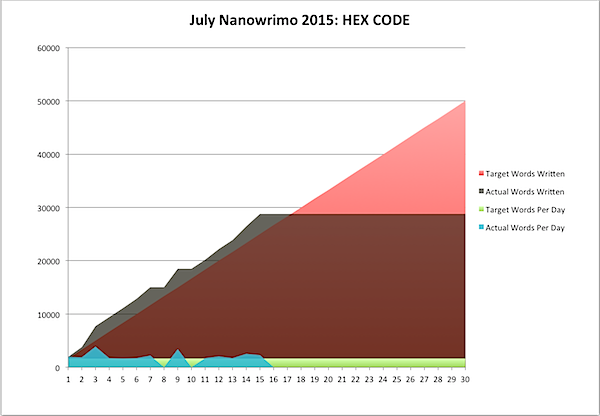
… just now getting to the point where I can think clearly. For a refresher, I’m working on the Spellpunk series, finishing up HEX CODE … and, since I discovered last time that I was actually writing all three Spellpunks in the same manuscript, there’s a small chance I’ll finish HEX CODE itself this month and move on to BOT NET. More news in a bit. That is all.
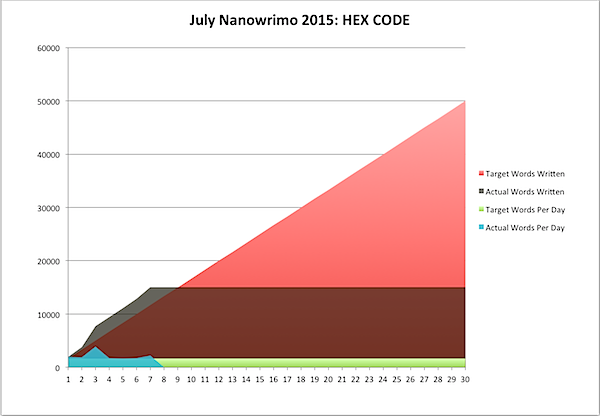
Well, another Nano has come to an end. I've added over 50,000 words to the HEX CODE manuscript, succeeding at the month's 50K as of a few days ago, and last night I added the framework for the last few scenes that the revised story still needed, putting me way ahead of the game. Calling it done … for now, that is.
It's interesting to compare this with previous months, as I did before. Even after the huge push near the end, I didn't quite catch up to the last time that I worked on HEX CODE. I must have been going gangbusters!

I'd love to keep going, but I now see why in the past, whenever I hit the limit, my writing rate dropped off. By my calculations, I have five novels due over the next two years - one down into the final edits, one in rough draft, one (HEX CODE) almost complete, and two more in lesser stages of completion. So it's good to take a breather … after climbing the mountain.

Now, back to CLOCKWORK ….
-the Centaur
As of this afternoon, I have completed an additional 50,000 words on my Cinnamon Frost novel HEX CODE … making me an official winner of the Nanowrimo challenge twelve times. Woohoo!
This was a good Nano, in that I stayed ahead of the game more than I thought I had. Even a couple of days I got physically sick helped me, as I holed up with my laptop and typed. Paradoxically, some of the best-feeling personal days I had this month I got no writing done at all. Yet, in the end, I managed to stay ahead, way ahead.
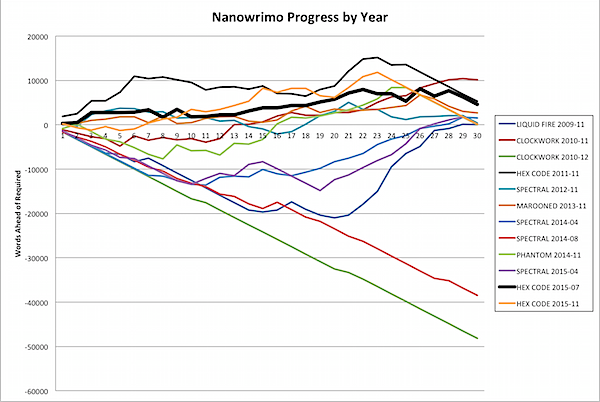
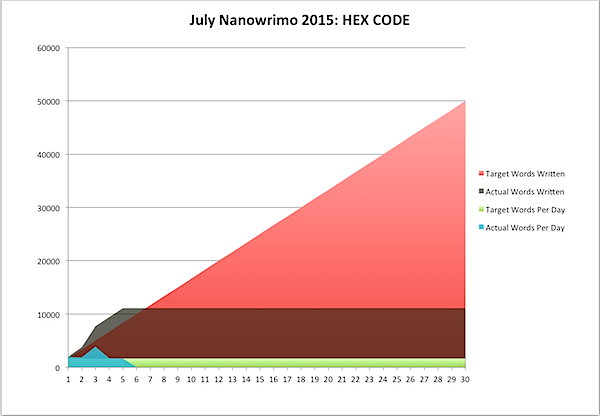
But, while analyzing this data, I found out something else … I haven't tackled Nanowrimo twelve times with one failure; I've tackled it fourteen times. You see, I remembered all the times I tackled Nanowrimo in November, and all the times I tackled Camp Nanowrimo, and even Script Frenzy. But ever since 2009, I've kept day-to-day word counts, and I found at least one more time I've tried Nano, in December of 2010. I was apparently having so much fun with CLOCKWORK TIME MACHINE that I decided to keep going. Putting all this data together revealed something very interesting: this hasn't been my best month at Nano.
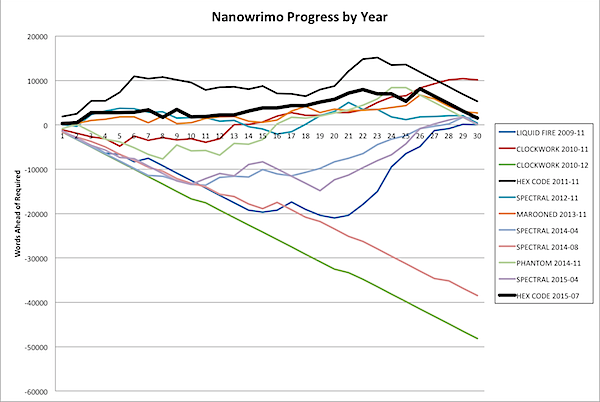
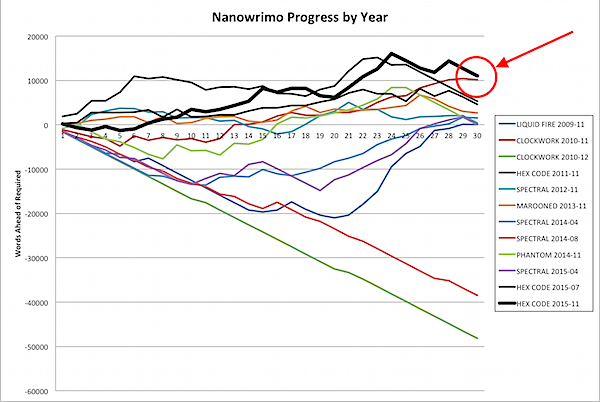
In a recent post, I said I thought I'd never been this consistently far ahead for this long, but was I wrong. Way wrong. In 2011, when I was tackling HEX CODE for the first time, I was so far ahead it's crazy: several thousand words ahead of my best times on all the other months. Apparently I was going gangbusters. This month was close, up till Friday and Saturday where I fell off a bit and then had to take a day of for writing business stuff, but today after writing 4,500+ words I ended up only 8,000 words ahead, but at this time in November of 2011 I was almost 13,000 words ahead.
Cinnamon is such a delightful character, it doesn't surprise me - though it does hurt your brain writing tens of thousands of words in broken English. Still, I'm really happy with how this book is developing. I realized, partway through this month, that this manuscript is actually the whole of the Spellpunk trilogy, and I reorganized it so the parts of #2 BOT NET and #3 ROOT USER were downstream of where I was writing, letting me focus on the story of HEX CODE #1, giving its own problems and climax. I think it's gone quite well, giving the story room to breathe, making certain events more rational because they can happen over time in a natural sequence … and giving Cinnamon even more time to shine.
I'll probably keep going on HEX CODE for a few more days making sure I core dump the rest of my story ideas, but then it will be back to editing THE CLOCKWORK TIME MACHINE in time to send it to Debra, then revising SPECTRAL IRON in time to send it to beta readers, plus two stories for an upcoming anthology, then an essay, plus conference travel, oh finishing the Hugo reading and voting, plus that wedding, and wait shouldn't I pay my bills aaaaaa ….
It's a wonderful life. Back to it!
-the Centaur
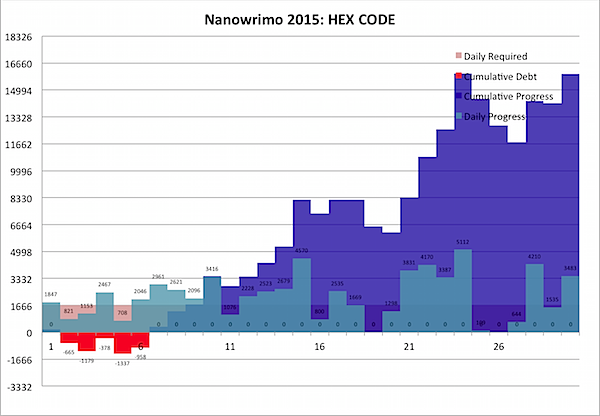
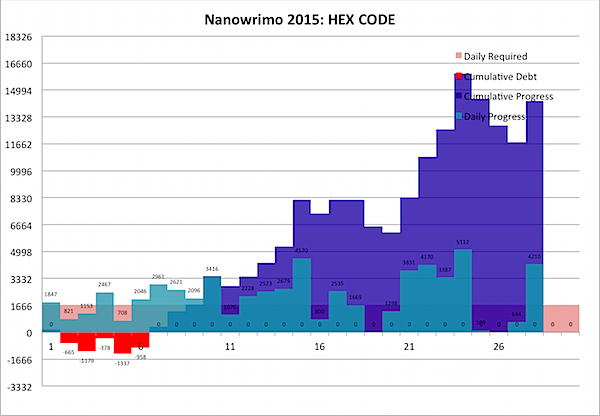
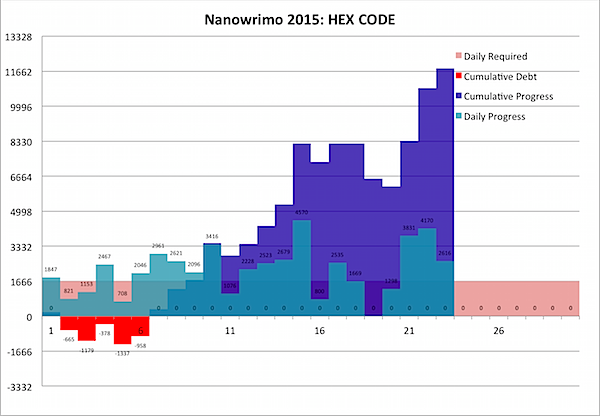
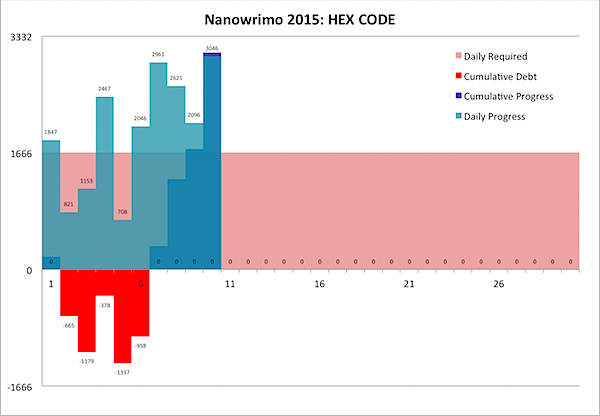
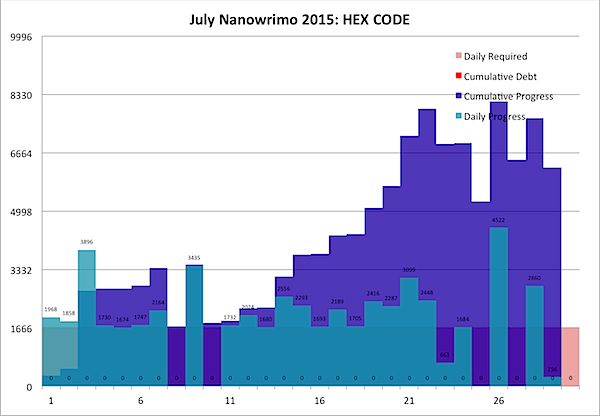
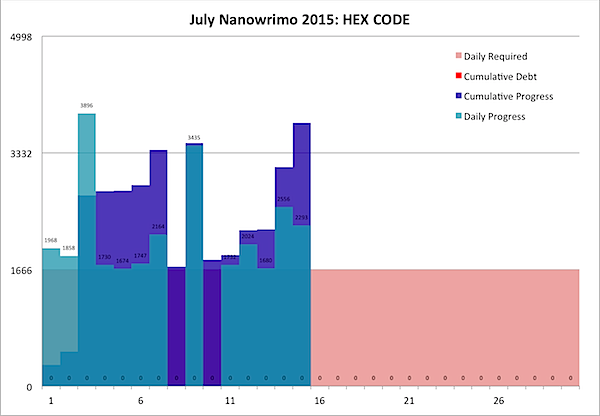
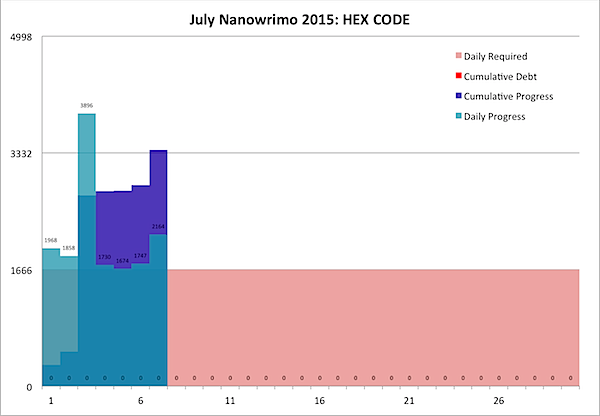
As you may be able to see above, I've managed to do something I don't recall having done ever in Nano: consistently stay ahead of the curve for the whole month to date. By my count, I'm almost 8% ahead of the game at the halfway point … over two full days.
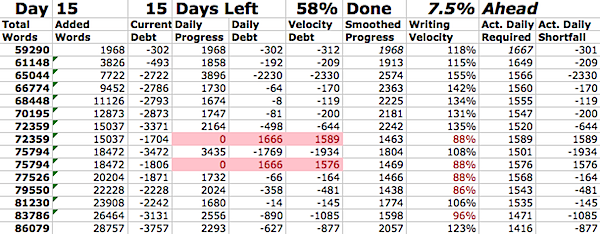
While there were a few days I didn't get any writing done, I was always ahead of the game, so I never fell behind … meaning the "Current Debt" column was always positive … meaning I'm always in the black. Huzzah!
This is a good feeling, but there's slightly more to it than that. I made a discovery. I'm not actually writing HEX CODE.
I've been writing the whole damn SPELLPUNK trilogy.
As I wrote, the story kept getting bigger and more bloated, while at the same time it was missing something. Threads left out. Pieces which didn't quite fit. The magical computer virus of the title, the "hex code", appeared in strangely spotty ways. And there were all these other threads, threads about the Werehold, the new werekin home.
I was thinking through how to fit these things together, and then started to notice something. I always had three titles in mind for the SPELLPUNK trilogy: HEX CODE, BOT NET, and ROOT USER (originally the last two were swapped, but whaddya know). And then I noticed: the first part of the book deals with the "hex code", then later a "bot net" appears, then later, in the last part of the story … a "root user" appears.
Am I writing the whole trilogy? I asked myself. I pulled in the 700 words I'd written on the second novel. I reorganized some sequences. I started fleshing out more and more pieces. Finally, I allowed myself to write a sequence that I had considered dropping, when I thought I was writing just one young adult novel. But if this part of the book isn't a part of a book, but an entire book in and of itself, that sequence was needed, was logical, was even demanded …
And 1400 words immediately popped out of my pen. (Well, keyboard, but you know).
So I'm even further ahead than I expected, not just on this month's Nanowrimo thanks to this burst of creativity, but now on the next few years of my life. I knew I needed to get three books out in the next year - THE CLOCKWORK TIME MACHINE, HEX CODE, and SPECTRAL IRON - and five in the next two years - PHANTOM SILVER and one or more sequels. But now, I'm closer to the end of HEX CODE proper than I'd ever thought I'd be, I have a huge jump on the sequels, these books will all be shorter than the 150,000 word behemoths that I'd been turning into Debra … and they'll have an inter-book cohesion that I've never attempted before, but which falls out naturally from the nature of the story.
In short, the story gets to breathe … and so will I.
At least, that's the theory. I still have five novels due in the next two years. So, back to Nano. I have almost 22,000 words to finish for this month, after all. But now I'm not just flying above the mountain; I'm soaring above it, rising on thermals to new heights. Now, beyond what I have due, I also have a ray of hope - and a plan for success.
Onward!
-the Centaur
Still plugging away at HEX CODE. But even in the middle of Nanowrimo, when I'm desperate to make my word count before my upcoming adventures, even when I have a good feel for what needs to happen in the next scene … it still helps to do research. Above you see a pile of books fairly typical for working on Cinnamon Frost stories, plus one recreational one (I'll leave it to you to figure out which one from the negative space of the context) and here's how they have helped me. For those just joining us, Cinnamon Frost is a teenage weretiger with Tourette's Syndrome who grew up basically on the streets, and ...
As for the last book, for now it's fun, but who knows, she's a math genius, so maybe it will work in.
I didn't read all of these over lunch, but I got a chapter or a half dozen pages of each, and as a consequence: I found out some interesting other conditions people might suffer from, gave them to a character, creating an instant conflict, and gave Cinnamon a new coping tool, leading to more conflict.
Easily three to five hundred words popped out of today's salsa of reading, putting me way ahead:
I'm doing my level headed best to not rest on my laurels though, as I have a LOT more to go:
Onward!
-the Centaur
… trying to get a good buffer before the crazy that is Comic-Con starts. That is all. Oh wait, an excerpt:
“So … how’s the investigation going,” I asks warily.
Mom chews, thinking. “Like shit,” she says. “One round of emails, mostly to my friends, but neither Philip nor Jinx nor Avenix were able to track the emails back to the source. They’re arguing now whether it’s Korean or Russian hackers, based on plaintext in the binaries, but—”
“That could be, like, contract work, or a smokescreen,” I says, tryin’ to keep up.
“Either one would be scary,” Mom says. “There’s more thought going into this assault than at first I thought.”
“And you’re still cuttin’ me out,” I says, scowling.
“Until Jinx gets us a way to look at the material without getting killed, yes.” Mom says. “After we have a better grip on what’s safe … actually, I would love your mathematical expertise on this one, Cinnamon.”
“Why?” I asks suspiciously.
“The mathematical patterns in the display code,” Mom says. “Jinx says they remind her of your cat’s cradles—”
“I did not have anything to do with this,” I says hotly.
“I know, I know,” Mom says, “but you are familiar with dangerous magic. I … I just don’t want you hurt, but you might be able to help us.”
“Fine,” I says. “Math is supposed to be fun, not a chore.”
“You don’t have to help,” Mom says.
“I’ll do it,” I says. “I … sigh, can I lay the cards on the table, Mom?”
“Sure.”
“I feel better, and want to go for a run tonight,” I says.
Mom purses her lips.
“I’ve already asked a friend from the werehouse, like you asked,” I says. I juts my chin out in defiance. “My boyfriend. Tully.”
Mom frowns.
“Whatdja got to say about that?” I asks defiantly.
Mom shrugs. “That … is what I said, isn’t it. Run with a friend from the werehouse—”
“It sure as hell is,” I shoots back.
“What about that thing on your ankle?” Mom says.
“I’ll be sure not to take it into any Edgeworld locations,” I says. “I ain’t stupid.”
Lots going on there. More to come. That is all.
-the Centaur
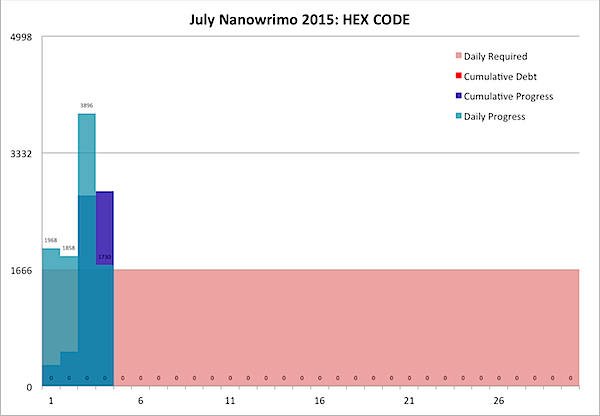
That's not a flag, but it is my Nanowrimo word count for the day, so I'm off to enjoy the Fourth of July holiday with my wife. If you're American, celebrate this moment - by convention, commemorating the signing of the Declaration of Independence, but by connotation, commemorating our liberty. If you're not American, hey, you can still take this moment to reflect on the ways in which you are free … and how important it is to preserve those freedoms. Enjoy the day!
-the Centaur
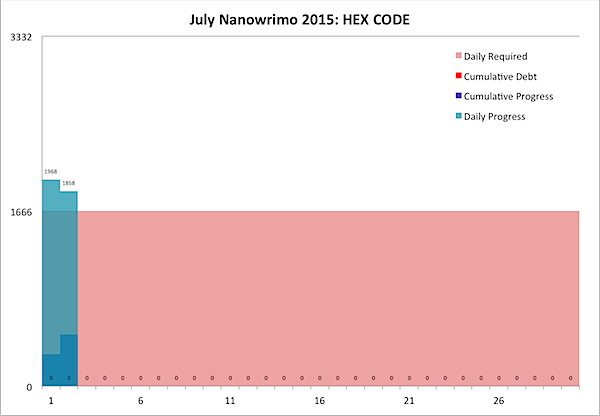
Normally a couple of days into a Nanowrimo project I'm already a bit behind, wondering how I'll catch up. Today I'm actually ahead for the second day in a row. Onward!
-the Centaur